Assignment 3

Author

Rebecca Larsen

Lab 3 - R Programming (EDA)

by Dr. Karl Ho

(Adapted from Stackoverflow examples) (Objectives: Use plotly, reshape packages, interactive visualization)

library(tidyverse)
library(plotly)
data(iris)
attach(iris)
# Generate plot on three quantitative variables
iris_plot <- plot_ly(iris,
                     x = Sepal.Length,
                     y = Sepal.Width,
                     z = Petal.Length,
                     type = "scatter3d",
                     mode = "markers",
                     size = 0.02)
iris_plot
# Regression object

petal_lm <- lm(Petal.Length ~ 0 + Sepal.Length + Sepal.Width,
               data = iris)
library(reshape2)

#load data

petal_lm <- lm(Petal.Length ~ 0 + Sepal.Length + Sepal.Width,data = iris)

# Setting resolution parameter
graph_reso <- 0.05

#Setup Axis
axis_x <- seq(min(iris$Sepal.Length), max(iris$Sepal.Length), by = graph_reso)
axis_y <- seq(min(iris$Sepal.Width), max(iris$Sepal.Width), by = graph_reso)

# Regression surface
# Rearranging data for plotting
petal_lm_surface <- expand.grid(Sepal.Length = axis_x,Sepal.Width = axis_y,KEEP.OUT.ATTRS = F)
petal_lm_surface$Petal.Length <- predict.lm(petal_lm, newdata = petal_lm_surface)
petal_lm_surface <- acast(petal_lm_surface, Sepal.Width ~ Sepal.Length, value.var = "Petal.Length")
hcolors=c("pink","lightblue","lightgreen")[iris$Species]
iris_plot <- plot_ly(iris,
                     x = ~Sepal.Length,
                     y = ~Sepal.Width,
                     z = ~Petal.Length,
                     text = Species,
                     type = "scatter3d",
                     mode = "markers",
                     marker = list(color = hcolors),
                     size=0.02)
# Add surface
iris_plot <- add_trace(p = iris_plot,
                       z = petal_lm_surface,
                       x = axis_x,
                       y = axis_y,
                       type = "surface",mode = "markers",
                       marker = list(color = hcolors))
iris_plot

Regression object

petal_lm <- lm(Petal.Length ~ 0 + Sepal.Length + Sepal.Width, 
               data = iris)

Homework 3

library(haven) 
TEDS_2016 <- read_stata("https://github.com/datageneration/home/blob/master/DataProgramming/data/TEDS_2016.dta?raw=true")

Creating new data subset with selective variables from original TEDS 2016 data.

myvars <- c("Tondu", "female", "DPP", "age", "income", "edu", "Taiwanese", "Econ_worse")
newdata <- TEDS_2016[myvars]

Re-code dependent variable “Tondu” with labels.

TEDS_2016$Tondu<-as.numeric(TEDS_2016$Tondu,labels=c("Unification now”, “Status quo, unif. in future”, “Status quo, decide later", "Status quo forever", "Status quo, indep. in future", "Independence now”, “No response"))

Run a regplot on the dependent variable with age, education, and income.

lm.fit=lm(Tondu~age+edu+income, data=TEDS_2016)
summary(lm.fit)

Call:
lm(formula = Tondu ~ age + edu + income, data = TEDS_2016)

Residuals:
    Min      1Q  Median      3Q     Max 
-3.7780 -1.1841 -0.4322  1.1079  5.4157 

Coefficients:
             Estimate Std. Error t value Pr(>|t|)    
(Intercept)  5.302529   0.257369  20.603  < 2e-16 ***
age         -0.004205   0.003194  -1.316   0.1882    
edu         -0.244608   0.037579  -6.509 9.96e-11 ***
income      -0.031855   0.016357  -1.948   0.0516 .  
---
Signif. codes:  0 '***' 0.001 '**' 0.01 '*' 0.05 '.' 0.1 ' ' 1

Residual standard error: 1.725 on 1676 degrees of freedom
  (10 observations deleted due to missingness)
Multiple R-squared:  0.04287,   Adjusted R-squared:  0.04115 
F-statistic: 25.02 on 3 and 1676 DF,  p-value: 7.771e-16
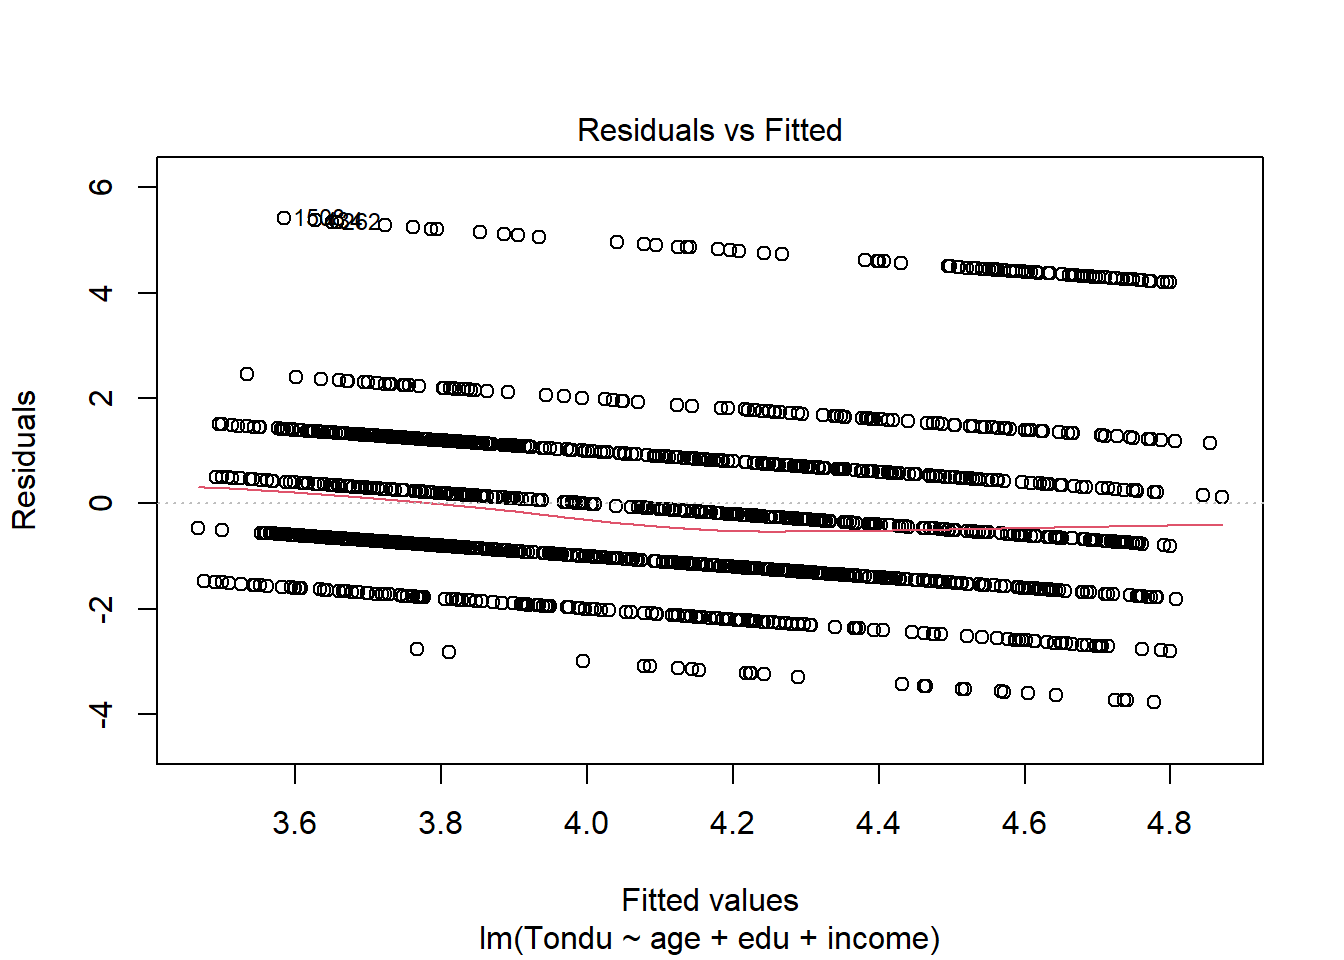
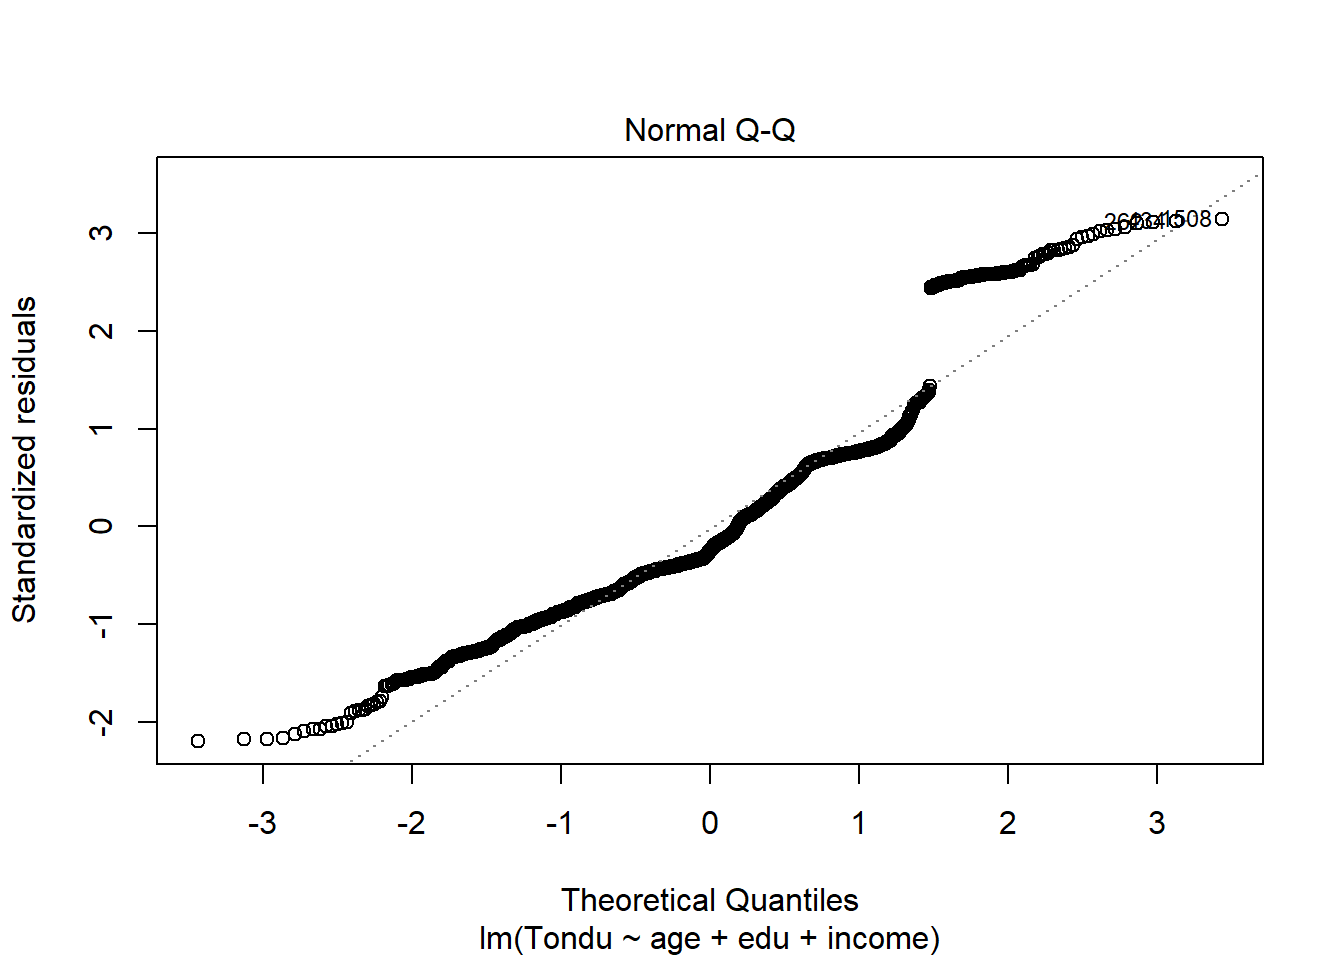
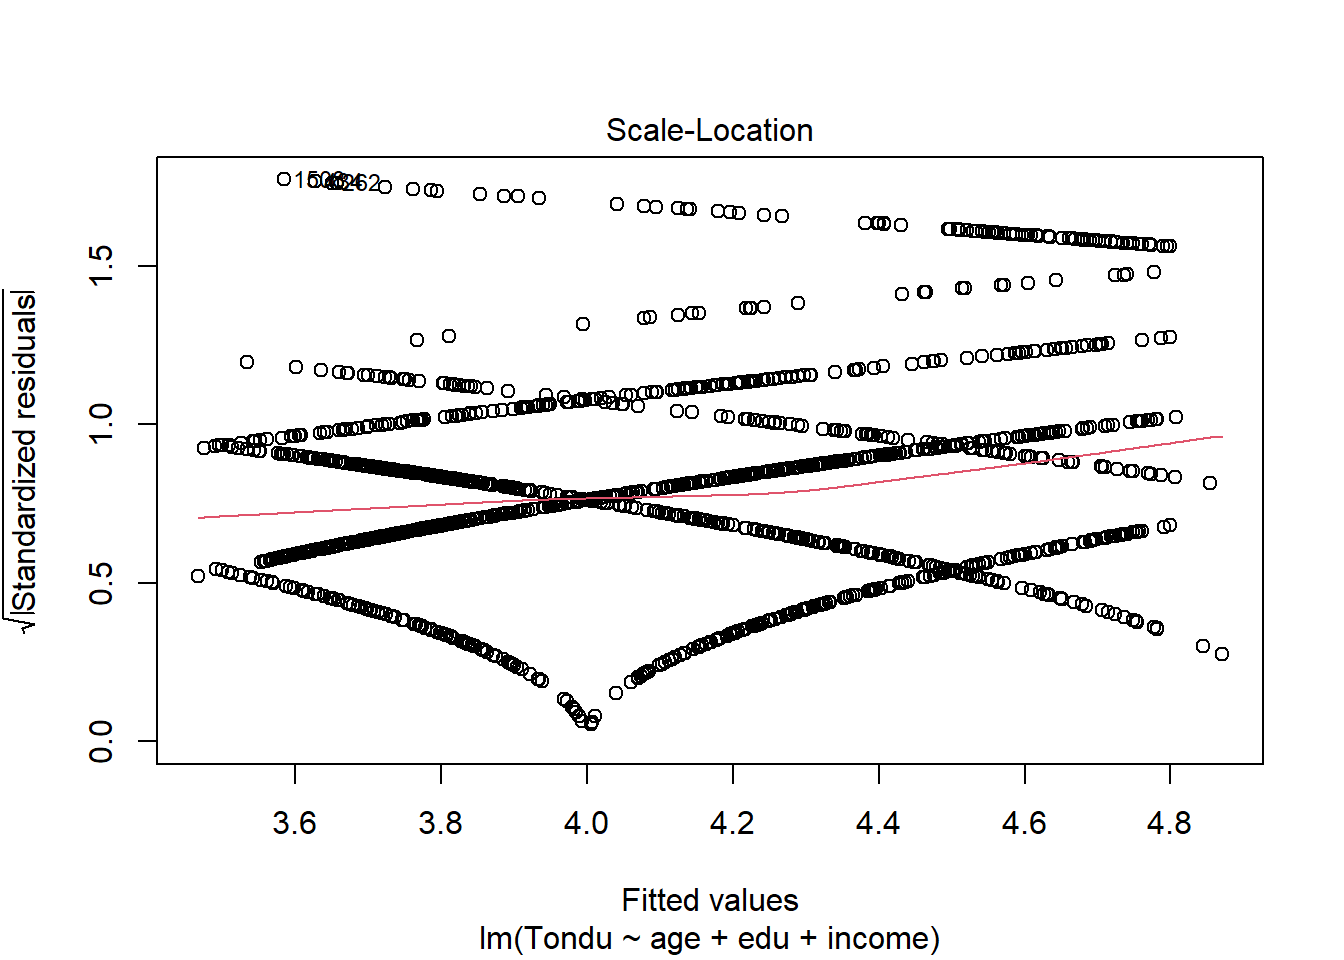
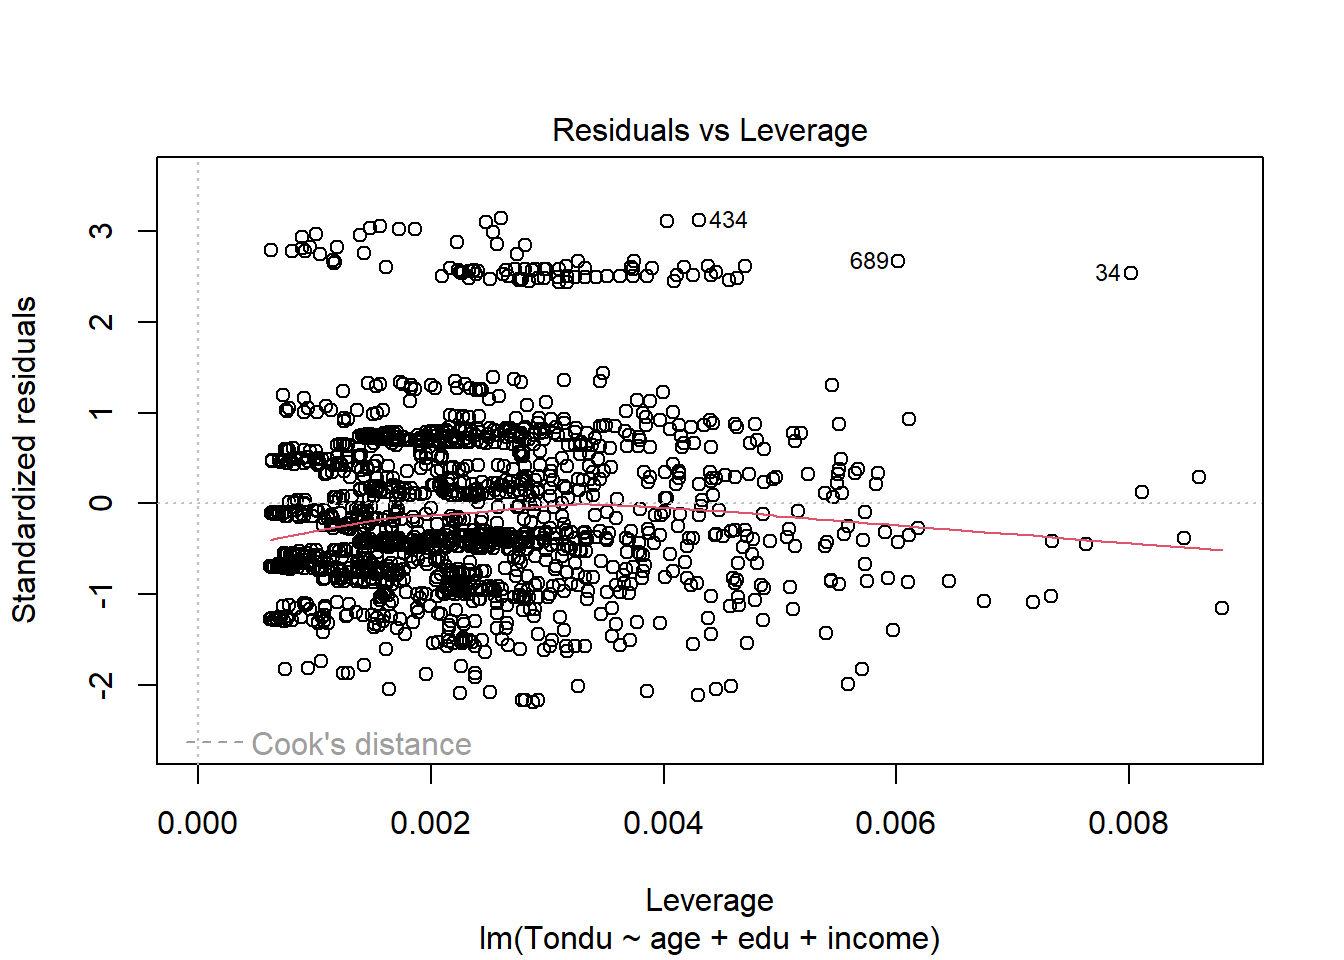
plot(lm.fit)

Question: What is the problem? Why?

Answer: Tondu is a 7-category nominal variable. Attempting to predict it with a linear regression does not work meaningfully. The scale is not consistent between categories and the higher numbers do not mean more of the variable than the lower numbers.

“No response” - Does not show up as a missing value but that’s what it is in practice. If there are a lot of “No responses” then that may impact prediction of the DV.

The results show that our current model does not have good fit (the above could be one possible reason to answer why).

Question: What can be done to improve prediction of the dependent variable?

Answer: A logistic regression is one option to potentially better predict a nominal categorical variable. However, a better first step is to test multiple models to determine which one has the best fit. We can do this by assessing their ROC curves.

“No response” issue - This could impact all models, so would want to find a way to either remove or treat these responses to that they do not become noise in your models.